IT Capabilities of Brazilian Space Weather Program
Nilson Sant’Anna, Clezio De Nardin, Hisao Takahashi, Joaquim E. R. Costa, I. S. Batista, André S. Ivo, Vitor C. Gomes, Rodolfo G. Lotte, Fernando O. Pereira, and Marcos P. Salgueiro
Abstract
Info! Dear researcher/scientist/academic, you may find some Wikipedia references in this page, which are totally directed for those that might not be familiar with terms and need a more illustrative and didatical understanding. Please, fell free to contribute at any moment.
Contextualization
In general, Brazilian Space Weather Systems must provide some typical computing activities like data collection, data processing, modeling (prediction) and dissemination of results. This includes consider some sources and data coming from: solar radio telescopes, ionosphere sounders/Ionossondes, GNSS receivers, Magnetometer arrays, optical imagers, radio frequency radars, sensors induced current, ionosphere modeling.
These stations generate data at different volumes and frequencies, which range from a few seconds to a few hours. Furthermore, it’s necessary to receive such data in (near) real time to perform monitoring 24 hours per day, 7 days per week.
To meet this demand, the architecture for this system was created, allowing us to receive large volumes of data with low latency, processing-intensive applications and reducing the possibility of data loss. Establishing a central monitoring and a high level of application availability are also keys issues and are taken into consideration to define the system architecture.
The IT architecture of the Brazilian space weather program is based on a system called Pipeline, which allows the continuous flow of information from the instruments into the servers of the program. In this scheme an application suite implements the data pipeline, which is established for each instrument.
The application that is closest to the sensor is called collectorAgent and is responsible for receiving the device data, perform the initial processing to convert into a standard transmission format and send the data to the next Pipeline stage. CollectorAgent is also responsible for handling problems with data delivery. Each device connected to a sensor has an instance of the collectorAgent.
The next stage of the pipeline is implemented by an application called ReceptorGateway. This application is responsible for receiving data from collectorAgents. An instance of this application is running in our operations center. The “ReceptorGateway” forwards the data to the processing queues. Each queue stores the data of a different category of equipment. The inclusion of data from a specific queue triggers the execution of applications for processing each data type.
The third stage of the pipeline scheme are application that consume data from the queue and perform the processing data. These applications are called Loaders. In general, they perform the data reading, post processing and storage of records in the database. This process ensures standardization in data storage and allows better management of information. The database stores the data collected by sensors, meta-data from instruments and acquisitions.
After storage of data in the database, another set of other applications are responsible for generating products to display data. The visualization system is web based. Currently viewing products that are already available are: Geomagnetic Components of the network of Magnetometers, K index of Magnetometers, Solar Radio Frequency Spectrometer, Ionospheric Scintillation, Scintillation Videos, Ionosonde Data and graphics from the Ionosonde foF2.
Source-code and tools
Arts:
| Illustrator | Photoshop |
Presentation
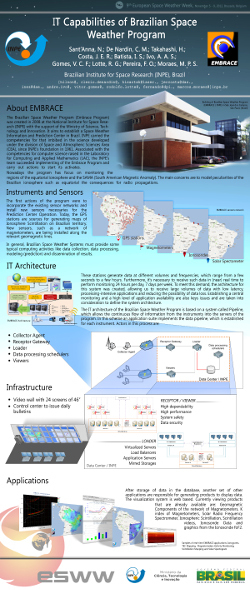 This work has been presented in a poster form (left), during the Ninth European Space Weather Week (ESWW), in the Académie Royale de Belgique, Brussels, Belgium, between 5 and 9 november of 2012. The poster can be download in the green buttom at the top of this page.
This meeting is being jointly organised by the Belgian Solar-Terrestrial Center of Excellence (STCE), the COST ES0803 communities, ESA and the Space Weather Working Team. The local organisation was done by the STCE. The event was built on the advances made during previous European Space Weather Weeks and preceding ESA Space Weather Applications Workshops.