3-dimensional (3D) urban mapping: A study of detection and reconstruction of building's facade through Structure-from-Motion (SfM) and Convolutional Neural Network (CNN)
Download thesis Download defense Related paper
Abstract
Info! Dear researcher/scientist/academic, you may find some Wikipedia references in this page, which are totally directed for those that might not be familiar with terms and need a more illustrative and didatical understanding. Please, fell free to contribute at any moment.
Contextualization
A 3-dimensional (3D) representation of cities became a common term in the last decade. What was once considered an alternative for visualization and entertainment, has become a powerful instrument of urban planning. The technology is now well-known in most of the countries on the European continent, such as Switzerland, England (AccuCities and Vertex Modelling), Germany, finally, Netherlands, and other. Also being commercially popular in North America, where many leading companies and precursor institutions reside. However, the semantic 3D mapping with features and applicability that go beyond the visual scope, is still considered a novelty in many other countries. In Brazil, according to the present study, the use of volumetric information as a resource for strategic and management planning is reduced to few cities.
The challenge of mapping and monitoring urban environments is a tough task, specially when apply under larger scales. Cities are dynamic environments, with a huge amount of shapes, sizes, the constant action of man, the presence of cars, vegetation, vehicles and pedestrians aggravate the extraction of key informations, which maximize the especialist capacity to handle tasks that involves their management.
However, not all cities are that chaotic. One city could present a better geometry when compared to another in terms of architectural styles, for example, the streets of Manhattan (wide), in United States, and the streets of Hong Kong (narrow), in China. In addition, suburbs use to have less traffic than city-centers, and that also affects the extraction. The term “complex” in this study refers to images where no preprocessing is performed, no cars are removed, no trees are cut off to benefit the imaging, no house or street was chosen beforehand, only images representing the perfect register of a real chaotic scenario were taken.
Currently, the solutions and resources available for systematic and volumetric mapping of cities, vary among the components of sophisticated imaging and computational tools, which aims to explore the imaged data in the most optimized way as possible.
This work was based on the following hypotheses:
- The volumetry of buildings, as well as their facade features (e.g. roof, windows, balconies, wall and doors), can be accurately extracted through optical images and SfM/MVS technique;
- Facade features can be automatically detected with CNN even under complex scenarios with no preprocessing need;
- The geometric quality of the 3D model, as well as the quality of the 3D labeling, is a direct function of the point cloud density;
- The geometric quality point cloud by SfM/MVS technique depends on the camera parameter estimation, image spectral and spatial characteristics. Therefore, the targets geometry and texture are fundamental in the process of reconstruction and classification.
followed by the main objective:
From structural data campaigns (image-based point cloud), the main objective of this research is to explore the extraction of geometric information of buildings, simultaneously, to detect their facade features and, finally, relate both information in one single 3D labeled model.
and specifically:
- Develop a routine to classify facade elements in 2-dimensional (2D) images using a CNN architecture;
- Using the same images, obtain the facade geometry using SfM/MVS;
- Evaluate the performance of the neural model for different urban scenarios and architectural styles;
- Evaluate a case study with an application in Brazil, whose architecture differs from the datasets used during the neural model training;
- Classify the 3D model of the extracted facade using the images previously segmented in the 2D domain by the technique of Ray-Tracing.
Methodology
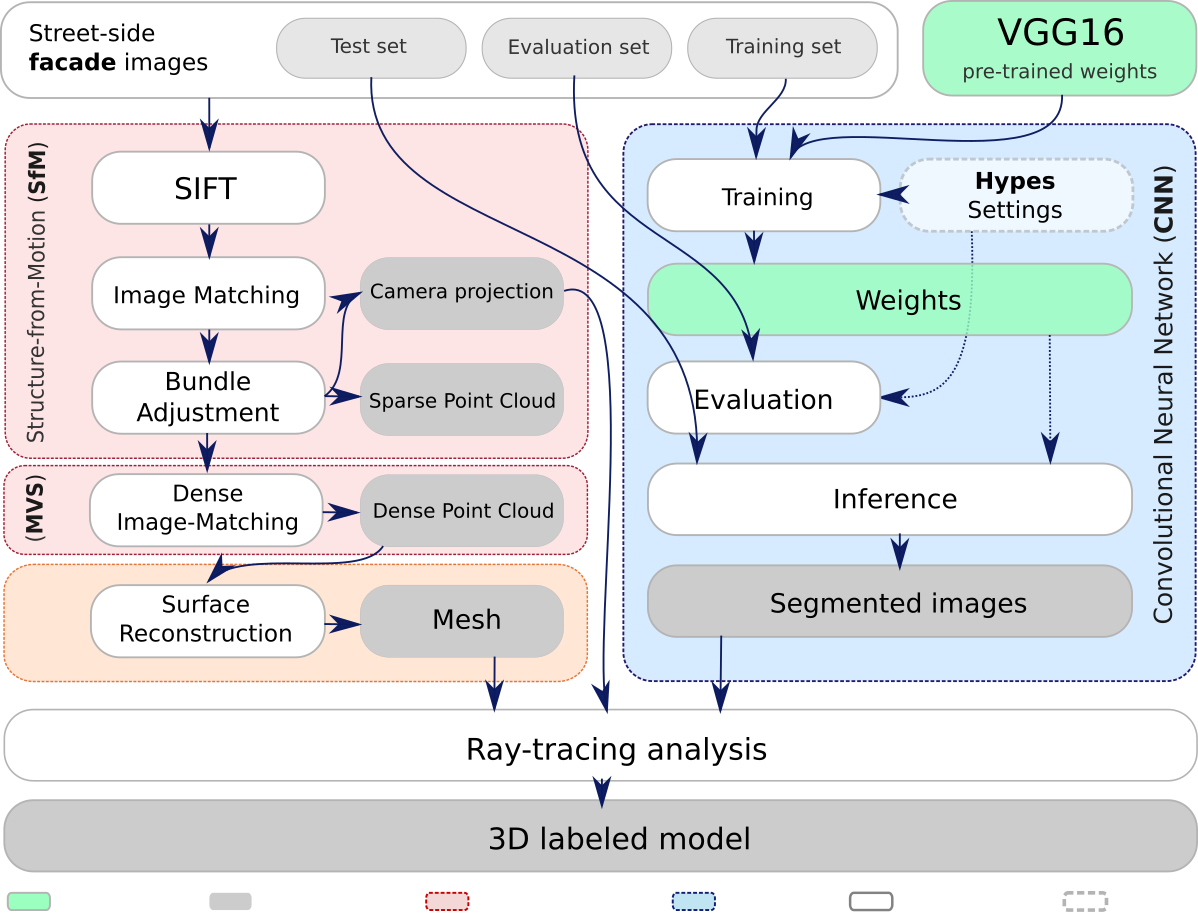
The complete methodology of this case study, as shown in Figure below, consists of three stages: A supervised CNN model for semantic segmentation (blue); Scene geometry acquirement (3D reconstruction) through SfM and MVS pipeline (red); Post-processing procedures (yellow); and 3D labeling through ray-tracing analysis (white). The boxes in gray represent the products, delivered in different steps of the workflow.
 Methodology
In summary, the first part comprises two paralell procedures: the applicability of Structure-from-Motion (SfM) and the Deep-Learning (DL) facade features training. The first one, takes into account the extraction of volumetry information from the facades. Once the geometry is extracted, characteristics such as shape, size, the many spare balconies, among others, complement more detailed analysis. However, the geometry itself can’t say much to sistematic analysis of buiding facades. It needs to have labels! It needs to have classified features for each of its geometry. In this sense, the DL complements with his ability to detect patterns under 2D images. Both extracted information: 3D (facade geometry) + 2D (facade features classified), integrates the outcomes of this methodogical stage.
Results
The DL source-code was mainly developed under the Tensorflow library and adjusted to the problem together with other Python libraries. Except for the 3D tasks in Agisoft Photoscan, the source-code are freely available in a public platform, and can be easily extended. For training and inferences, it was used an Intel Xeon CPU E5-2630 v3@2.40GHz. For SfM/MVS and 3D labeling, respect to RueMonge2014 and SJC datasets, it was used an Intel Core i7-2600 CPU@3.40GHz. Both attended our expectations, but it is strongly recommended machines with GPU support or alternatives such as IaaS (Infrastructure as a Service).
The Figure below shows the inferences from Ruemonge2014 dataset over the validation set. Instead of showing only a few example results, they were exposed as much as possible to allow the reader to better understand how the neural model behaves according to different situations. Here, it is positively highlighted two aspects. First, the robustness of the neural model in the detection of facade features even under shadow or occluded areas, such as in the presence of pedestrians or cars. This aspect has been one of the most difficult issue to overcome due to the respective obstacles being dynamic and difficult to deal with, especially by the use of pixelwise segmenters. The second aspect is that at 50 thousand (k) iterations, all images presented fine class delineation. Only in a few situations the inferences were not satisfactory.
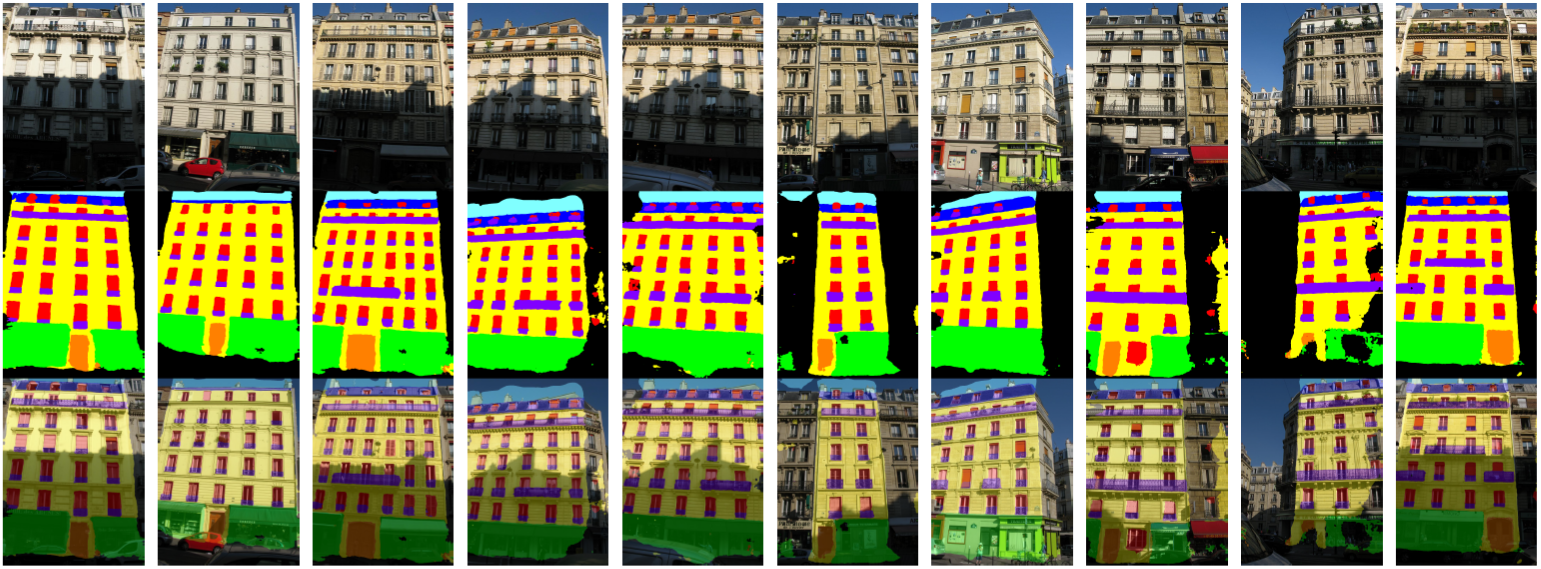
| (a) | (b) | (c) | (d) | (e) | (f) | (g) | (h) | (i) | (j) |
Results over Ruemonge2014. The rows are splited respectively in original, segmented image, and both. These segmented images are the inferences under evaluation sets only. (a)–(j) Example of RueMonge2014 images, segmented by the neural model presented. In the first row, the original image, the second row, the result of the inference (segmentation), and the third and last, the overlapping images.
The quality of the reconstructed surface (mesh) is highly dependent on the density of the point cloud and the method of reconstruction. Very sparse point clouds can generalize feature volumetry too much, while very dense point clouds can represent it faithfully, but the associated computational cost will also increase. Therefore, there is a limit between the quality of the 3D labeled model and the point cloud density, which falls on the question: how many points it is needed to fairly represent a specific feature?
Features that are segmented in 2D domain might perfectly align with their geometry, but imprecisions between the geometric edges and the classification may occur. Despite of that, the segmentation alignment onto the mesh is also related to the estimated camera parameters, which are used during ray-tracing. These impressions are directly related to the mesh quality.
 3D labeled model of RueMonge2014. Wide view of the street, facade geometry and its labels after ray-tracing analysis
Considerations
Increasingly, the research regarding the facade feature extraction from complex structures, under a dynamic and hard-to-work environment (crowded cities) represent a new branch of research, with perspectives to the areas of technology, such as the concept of smart cities, as well as the areas of Cartography, toward to more detailed maps and semantized systems. In this study, an overview of the most common techniques was presented, as well as an introduction of instruments and ways of observing structural information through remote sensing data. Besides, was also presented a methodology to detect facade features by the use of a CNN, incorporating this detection to its respective geometry through the application of a SfM pipeline and ray-tracing analysis.
The experiments are mainly focused in aspects such those aforementioned techniques and their computational capability in detecting facade features, regardless of architectural style, location, scale, orientation or color variation. All the images used in the training procedures underwent no preprocessing whatsoever, keeping the study area as close as possible as to what would be a common-user dataset (photos taken from the streets).
In this sense, the edges of the acquired delineated features show the robustness of the CNN technique in segmenting any kind of material, in any level of brightness (shadow and occluded areas), orientation, or presence of pedestrians and cars. Considering that the values achieved for the individual datasets were above 90%, it is concluded that the CNNs can provide good results for image segmentation in many situations. However, being a supervised architecture, the network has to pass through a huge training set, with no guarantees of good inputs, in order to get reliable inferences. When applied over unknown data, such as the experiment on the SJC data, it was noted that the neural network failed, except in regions where the facade features share similar characteristics, though such occasions were rare.
Identifying facade features under a great variety and arrangement make up these tasks still a scientific challenge whose tendency is to expand. The technologies to observe cities, such as sophisticated sensors, reconstruction and classification techniques, evolve as the numerous architectural styles change according to local culture and way of life. Moreover, it is essential to think that the multiplicity of architectural styles is not the only problem. Studies, such as those carried out at the MIT Center for Art, Science and Technology (CAST), Massachusetts Institute of Technology (MIT) and at Eidgenössische Technische Hochschule (ETH) Zürich, show, for example, that materials used in construction might become dynamic and therefore do not present a single static structure of a building. Urban occupation tends to evolve, which also demands that mapping techniques must both to follow the current architectural structures, as well as their eminent evolution.
Source-code and tools
For training and image processing, I use Python coding language and PyCharm IDE for most of the tasks (in this stage, Tensorflow, and common image processing libraries had been adopted). For the ray-tracing processing, the C++ language was used. CGAL and PCL were used during the point-cloud experiments, such as individual points classification, simplification, and geometry analysis. For documentation, the LaTeX and Kile editor were used. Below, each tool is presented as an icon, together with its frequency of use.
Coding:
| CGAL | PCL | Tensorflow | C++ | Python |
IDE:
| PyCharm | CloudCompare | Meshlab | QGIS |
Arts:
| Blender | Illustrator | Photoshop | InDesign |
Documentation
| Kile | LaTeX |
To exemplify, the .gif below, shows an example of the 3D labeled model on Meshlab, which gives all support for processing and visualize either point cloud or 3D mesh format files.
 Example of a 3D .ply file handled in Meshlab. The animation shows the 3D labeled model of one of the streets used in this work (Ruemonge2014 dataset), as well as the differences between sparse and dense mesh
Presentation
 The defense of the thesis toke place at National Institute for Space Researche (INPE), at 9am, and was composed by the examiners Prof. Dr. Thales Körting (INPE), Prof. Dr. Norbert Haala (IfP-Sttutgart), Prof. Dr. Edson Mitishita (UFPR), Prof. Dr. Antônio Maria G. Tommaselli (UNESP-Prudente), Dr. Fabien H. Wagner (INPE), Dr. Luiz E. O. E. Aragão (INPE-Advisor), and Dr. Yosio E. Shimabukuro (INPE-Advisor).
The presentation was unanimously approved and is available physically and virtual,ly for consults in the collection of INPE library, in São José dos Campos. The direct link for digital source, simply click on the red button above.
Cite this thesis
@PhDThesis{lottethesis,
               author = "Lotte, Rodolfo Georjute",
                title = "3-dimensional (3D) urban mapping: A study of detection and reconstruction of building's
                facade through Structure-from-Motion (SfM) and Convolutional Neural Network (CNN)",
               school = "Instituto Nacional de Pesquisas Espaciais (INPE)",
              address = "São José dos Campos",
                month = "2018-08-24",
             keywords = "3D urban mapping, facade features, deep-learning, convolutional
                         neural network, structure-from-motion.",
            committee = "Aragão, Luiz Eduardo Oliveira e Cruz de and Shimabukuro,
                         Yosio Edemir and Körting, Thales Sehn and Wagner, Fabien
                         Hubert and Tommaselli, Antônio Garcia and Mitishita, Edison
                         Aparecido and Haala, Norbert",
         englishtitle = "Mapeamento urbano tridimensional (3D): Um estudo sobre
                         detecção e reconstrução de fachadas de
                         edificações por Estrutura-por-Movimento (SfM) e Redes
                         Neurais Convolutivas (CNN)",
             language = "en",
                pages = "139"
}
References
- AccuCities LTD. 3D Model of London & 3D City Models. 2017.
- Adriaenssens, S.; Gramazio, F.; Kohler, M.; Menges, A.; Pauly, M. Advances in Architectural Geometry 2016. [S.l.]: vdf Hochschulverlag AG, 2016. ISBN 978-3-7281-3777-7.
- Bódis-Szomorú, A.; Riemenschneider, H.; Gool, L. V. Efficient edge-aware surface mesh reconstruction for urban scenes. Computer Vision and Image Understanding, v. 157, p. 3–24, 2017.
- Furukawa, Y.; Curless, B.; Seitz, S. M.; Szeliski, R. Clustering views for multi-view stereo. In: Computer Vision and Pattern Recognition (CVPR). Proceedings… San Francisco, CA, USA: IEEE, 2010. v. 13, p. e18.
- Furukawa, Y.; Ponce, J. Accurate, dense, and robust multi-view stereopsis. In: Computer Vision and Pattern Recognition. Proceedings…Minneapolis, MN, USA: IEEE, 2007. p. 1–8. ISSN 1063-6919.
- Furukawa, Y.; Ponce, J. Patch-based multi-view stereo software. 2010.
- Lecun, Y.; Bengio, Y.; Hinton, G. Deep learning. Nature, v. 521, n. 7553, p. 436–444, 2015.
- Martinovic, A.; Knopp, J.; Riemenschneider, H.; Gool, L. V. 3D all the way: semantic segmentation of urban scenes from start to end in 3d. In: CONFERENCE ON COMPUTER VISION AND PATTERN RECOGNITION. Proceedings… Boston, Massachusetts, USA: CVPR, 2015. p. 4456–4465.
- Riemenschneider, H.; Bódis-Szomorú, A.; Weissenberg, J.; Gool, L. V. Learning where to classify in multi-view semantic segmentation. In: EUROPEAN CONFERENCE ON COMPUTER VISION. Proceedings… Zurich, Switzerland: ECCV, 2014. p. 516–532.